
In a food industry group, several plants relied on the same Excel file to process their sales forecasts. The file was mature, the teams could no longer do without it, and it was reaching its limits. This case study describes how we turned this Excel forecasting file into a custom web application, the technical choices involved and what we learnt from it.
Background: an Excel forecasting file shared by several plants
Sector: food industry, poultry processing. Scope: several plants within a group. Existing tools: an ERP handling production management and supplying three Excel extractions, and an Excel forecasting file that consolidated these extractions, applied standard weekly forecast profiles, managed baseline and promotions, then produced the return file for the ERP.
The main users are the planners; the sales department adjusts the forecast quantities. The extractions sometimes exceed 200,000 lines.
The problem: a file at the end of its tether
The file saved a great deal of time, but it ran into Excel's well-known limits for this kind of use:
- Performance. The volume of data slowed the workbook down badly. To protect it, a separate file had been created for each forecast year: at the end of the year, the teams juggled two files.
- History. Previous years could not be kept in the same tool.
- Traceability. The sales department could change forecast quantities outside the agreed deadlines. These discreet adjustments affected planning, with no way of tracing them.
- Realignment. Before exporting to the ERP, the planner had to realign promotions and baseline product by product, a lengthy step in Excel.
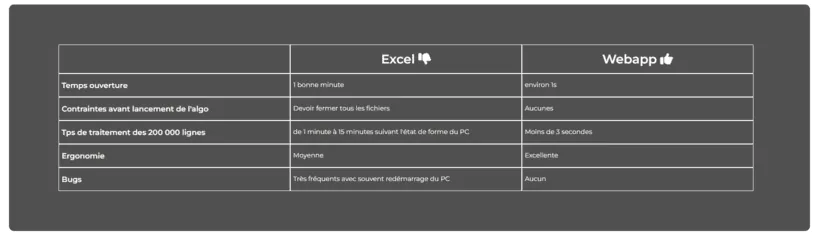
In parallel, the ERP development team was working on building this process into the ERP itself, with processing times incompatible with daily use: a coefficient could only be applied to one week at a time, at around 15 seconds per week, or 52 operations for a year; and generating the forecast file took 20 to 30 minutes, hence a scheduled overnight run.
What we built
Ergonomics that feel familiar
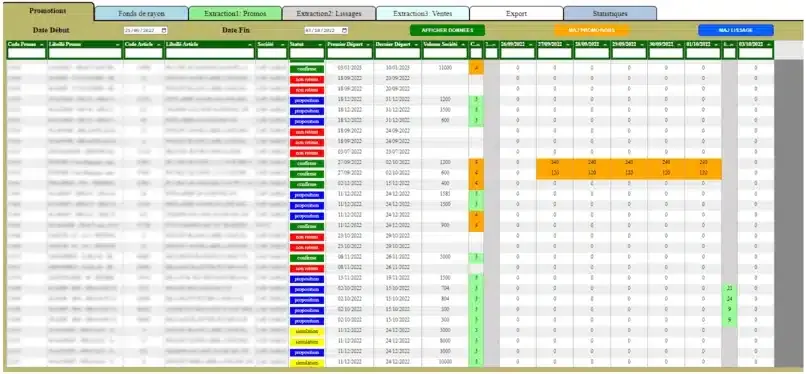
To avoid disrupting users, the navigation follows the workbook's tabs; the active tab is in bold and slightly larger. The three ERP extractions (“extraction1”, “extraction2”, “extraction3”) are still loaded in Excel format, by standard file selection or by drag and drop into the browser. An EDI link would have been possible.

The main table offers what users expected from Excel: direct entry in cells with immediate database update, bulk editing of standard baselines, a filter on every column header, Sundays greyed out, public holidays detected and shaded, and date ranges for promotions.
A data model built around the item
We chose a MongoDB database, in NoSQL. Each item is an object containing its characteristics, promotion forecasts, baseline and actual sales; an item with no promotion simply has no such sub-object. The project run on the ERP side relied on many SQL tables and heavy joins, and did not reach the same level of performance.
Forecasting algorithms on demand
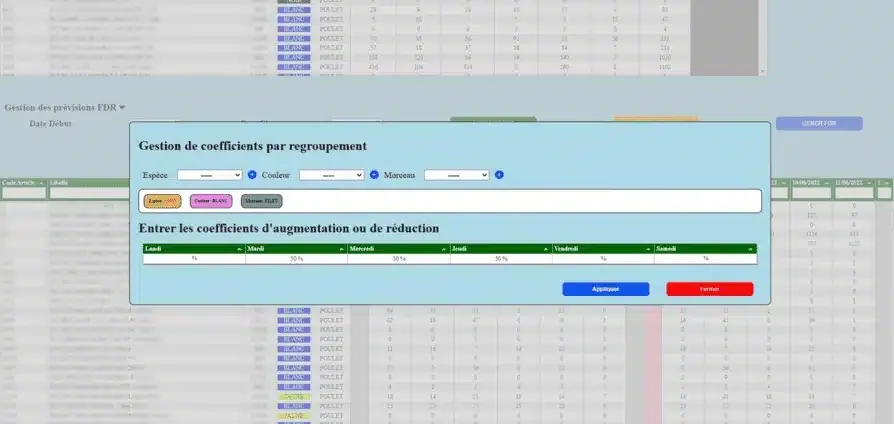
The application offers several algorithms: applying standard forecast profiles to the weeks of the year, coefficients by family or sub-family, and generating the baseline over a long period from the table of standard baselines. The criteria are detailed: for example, increasing sales of white organic poultry by 50% on Tuesdays and Wednesdays over a given period.
A change history, Excel style
Each edited cell keeps the previous value and the date of the change, shown on hover in a comment with the familiar small red triangle. Several successive changes build a structured history, which helps explain an anomaly and shows that the forecast is being monitored.

Real-time statistics and instant export
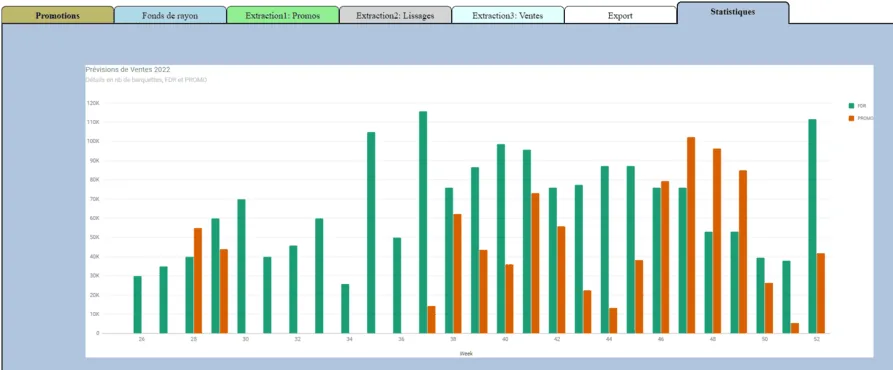
With every change, a child process recalculates the statistics in parallel with the main process, and the chart updates when the event is received: no more wondering whether the data is up to date, and no more waiting for an overnight run. Column display is configured with one button, for example “BASELINE vs ACTUAL” to compare baseline and actual sales.

The export to the production management system produces a CSV or TXT file in the format expected by the ERP, aligned product by product between promotions and baseline. The user chooses the start date, the number of days and the destination folder; the Node.js back end can also write directly to a server folder, with the IT department's approval. Generation relies on a pre-formatted table, updated with every forecast change.

Technologies: Express, EJS, MongoDB, Multer, child-process, Tabulator, Google Charts, Socket.io.
Results of the digitalisation
- The algorithms process several tens of thousands of lines in under 3 seconds, and the table stays responsive.
- Ten years of forecasts are generated in one click, compared with 52 operations of around 15 seconds each for a single year in the ERP project.
- The forecast file for the production management system is generated instantly, at any time, compared with 20 to 30 minutes and an overnight run on the ERP side.
- All years are managed in the same application, with no juggling between files.
- Changes made by sales are logged, dated and visible to the planners.
What we took away from this project
A mature Excel file is a requirements specification: it contains the business rules, validated by years of use. Digitalising does not mean reinventing the process; it means moving it into a tool that handles the volume, keeps the history and logs every change. Keeping the familiar ergonomics (tabs, filters, in-cell entry, comments) made the difference for adoption.
The data model matters as much as the interface: one object per item gave calculation times far beyond anything a multi-table approach could reach. Finally, real time is not a luxury: no longer wondering whether a figure is up to date changes the way users relate to the tool.
Where it stands today
What was custom-built in this project is now standard in Planiprev : item-by-item forecasting, baseline kept separate from promotions, coefficients, change history and comments, projected stock and stock cover, import of ERP extractions or Excel workbooks, and export to the production management system. Other projects are described in our case studies. Request a demo.