
Where is this order? Which operation is it stuck on, and what was shown to the operator who made it? In a workshop where a manufacturing order passes through ten or fifteen operations spread over several lines, answering requires a screen that shows the whole flow at a glance. This case study tells how we built a map of the production flow in custom production management software connected to the ERP: a control tower that tracks each manufacturing order operation by operation.
Background to the flow mapping project
The client is a joinery manufacturer using the Diapason ERP (Elcia). We were designing custom production management software connected to this ERP for them, as part of the shop floor terminals programme described elsewhere. For this project, the client set up an internal business team, with a contact in each workshop, to map the production flows while we handled the technical side.
Why the ERP steps were not enough
The ERP already tracked manufacturing steps, but at a coarse level: each step validated in the ERP triggers a stock consumption, and that is its job. These steps do not say where the order physically is between two consumptions. The client wanted a screen that could answer questions at three moments in the life of a manufacturing order.
- Before release: check that the order has been properly integrated, which manufacturing flow it will follow and what information will be shown at the workstations.
- During production: know the status of each operation (done, in progress, to come) and spot blockages.
- After manufacture: find what was given to the production team, to justify technical choices in the event of a customer dispute.
And it had to be possible to zoom in: from the whole order down to a specific operation, with its details.
Mapping the production flow, step by step
1. The right questions, in an Excel workbook
Before any configuration, the business team answered a series of questions, workshop by workshop:
- Which manufacturing operations need to be tracked?
- What dependencies are there between these operations?
- One or several operators per operation? Does the operator or team handle other operations?
- Is a computer workstation needed for each operation?
- What actions must the operator carry out (start, pause, finish, stock movements)?
The answers took the form of a simple Excel workbook: one tab for the links between operations and the conditions under which each exists, a second for the additional information on each node. This flowchart served as the requirements specification.
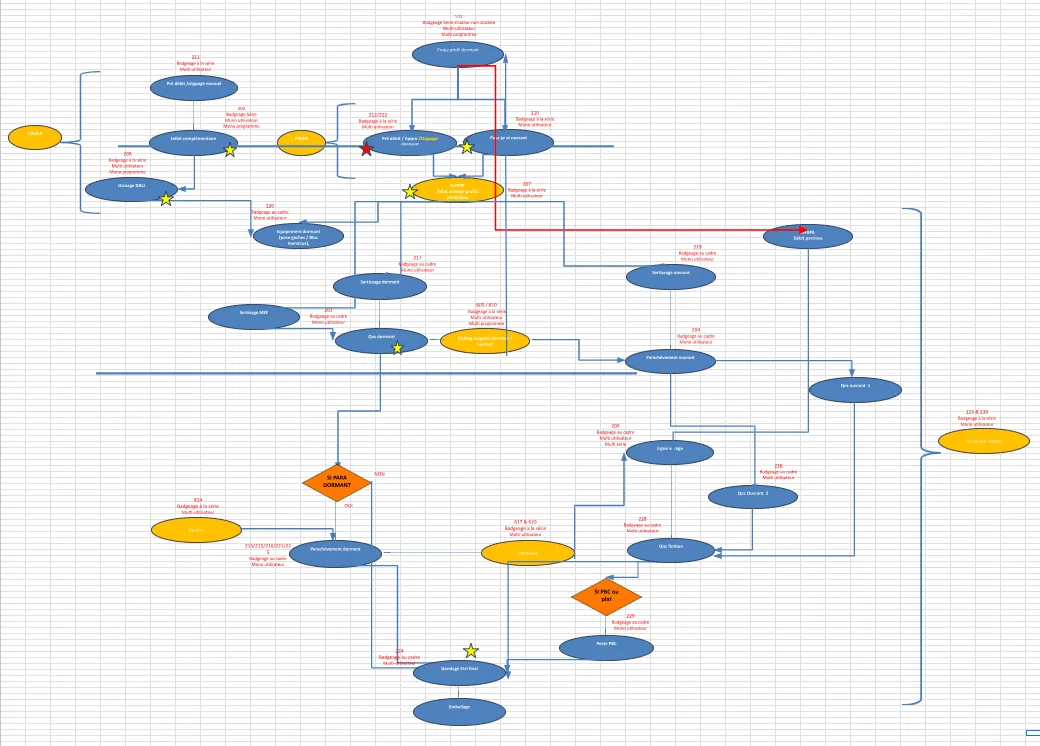
2. One ERP step, several shop floor operations
We decided that each ERP step would correspond to several operations in the production software. The first task was therefore to map the ERP steps, which remain the point of stock consumption, to the operations in the production software, which carry the detailed tracking. The ERP keeps its role, and the production software adds the detail it could not provide.
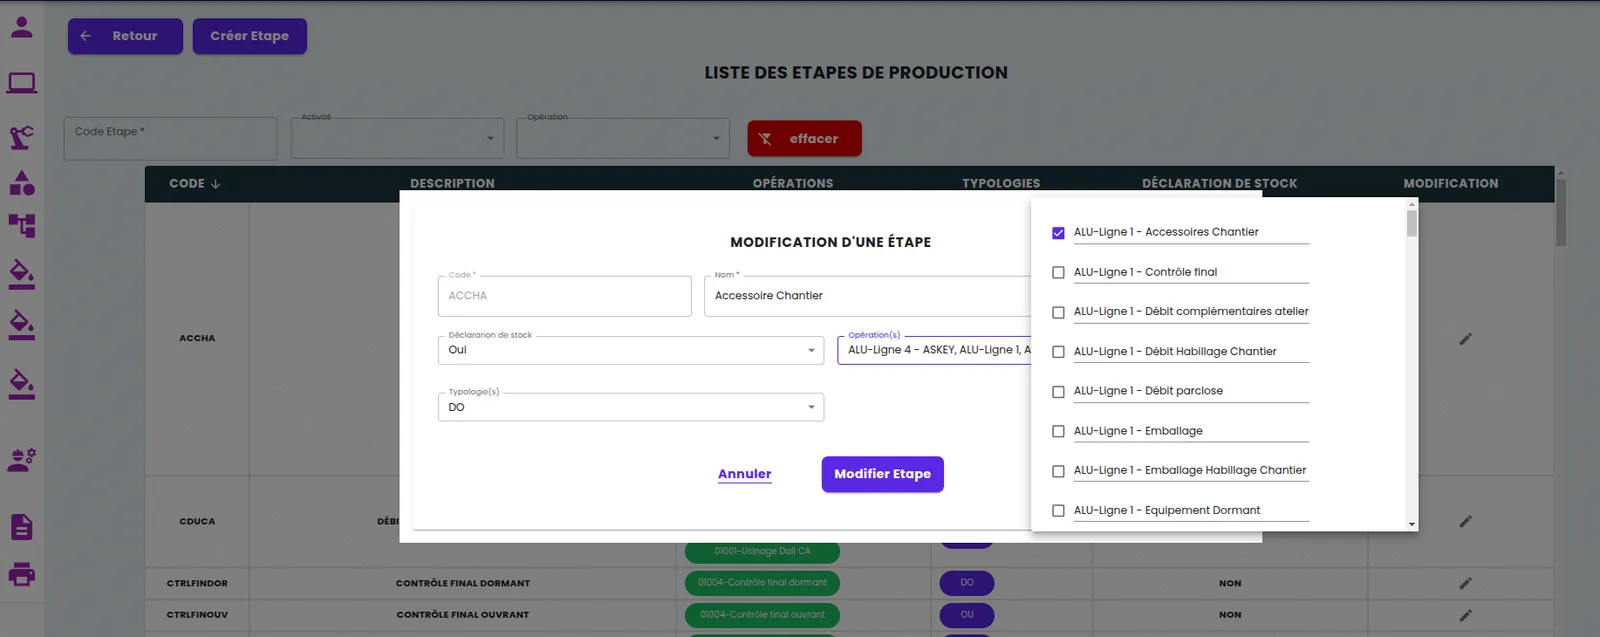
3. Operations attached to a line, with their dependencies
A form for creating operations attaches each operation to a production line. An operation shared between several lines is recorded separately for each one: this is what allows the specifics of each flow to be handled. Each line carries its dependencies (one operation must be finished before another starts) and each operation can receive additional criteria specific to the flow.
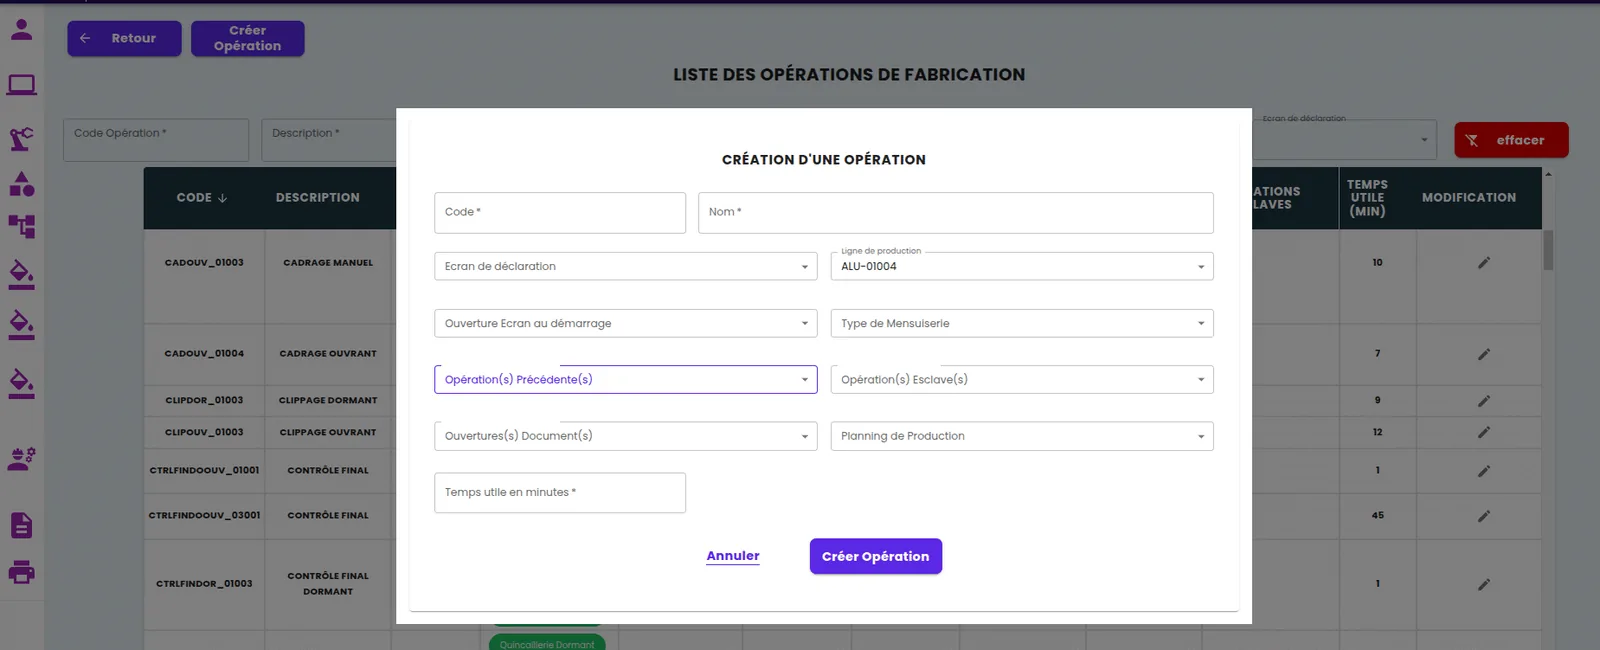
4. From the theoretical flow to a map of each order
Once the operations and their dependencies are configured, the theoretical map appears: an overview of the whole plant. Integrating a manufacturing order then links it to this flow. Some operations depend on the product options and become optional; if they are not needed, they are shown in black. Every start, suspension, blockage or end of an operation updates the status in the order, and operations change colour according to their status. Each manufacturing order therefore has its own map.
The client asked for two additions: double-clicking an operation opens the associated workstation, with its workload; and some operations show specific information (bill of materials, components, dimensions, colours), with the option to zoom in on the order.
Results of the production flow map
The map became the plant's control tower: the progress of each order can be read operation by operation, blockages are visible, and the detail of an operation is one click away. Tracking is currently done by calling up a specific order; the client has asked us to extend it to a view of the whole workshop, which is the next phase of the project.
What we take away from flow mapping
Mapping the production flow is not IT work: it is shop floor work. The Excel workbook filled in by the workshop managers took more back-and-forth than developing the screen, and that is normal: it forces people to say which operations really exist, which are optional and who runs them. Second lesson: do not ask the ERP to do what it cannot do. Keeping its steps as consumption points and adding detail underneath, in the production software or MES, avoids distorting the ERP and slowing down stock validations. Finally, a map is only useful if it moves: the status must come from operators' declarations at the workstations, never from a manual update.
And today: real-time order tracking as standard
The core need of this project, seeing the progress of each manufacturing order in real time, operation by operation, from declarations made at the workstations, is covered as standard by Planitrack : scanning of the order and the operation with a handheld scanner or a phone, live order progress, drag-and-drop shop floor scheduling. It connects to your ERP or reads your Excel files. Request a demo.